10 charts that describe entrepreneurs
For over a decade, first being associated with a startup that was acquired and then having started up, I found myself intrigued by the quirks and habits of the entrepreneurial folk.
My fascination with visualisations made me wonder if I could come up with informative charts and graphs that could portray the behaviour of startup founders. Unfortunately, quite a few of the parameters I considered were hard to quantify in conventional graphs ‑ as in histograms, pie charts, and the like.

But, with the help of a master designer and a friend Anupriya Mohanya, we created this series that is intentionally irreverent and humorous. I hope this strikes a chord with not only entrepreneurs but also those involved with startups.
1: When an entrepreneur says his idea “Is disruptive”
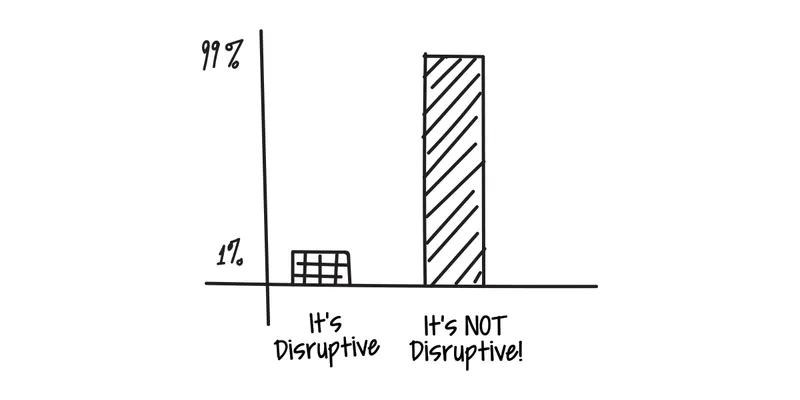
No, “Tinder for rich folks” isn’t disruptive. Neither is that pitchdeck on “Slack meets Asana”, (as cool as that sounds!). The truth is, hatching “disruptive” business ideas /models is not as easy or as common as we founders like to believe.
2: The “Should I do it?” chart
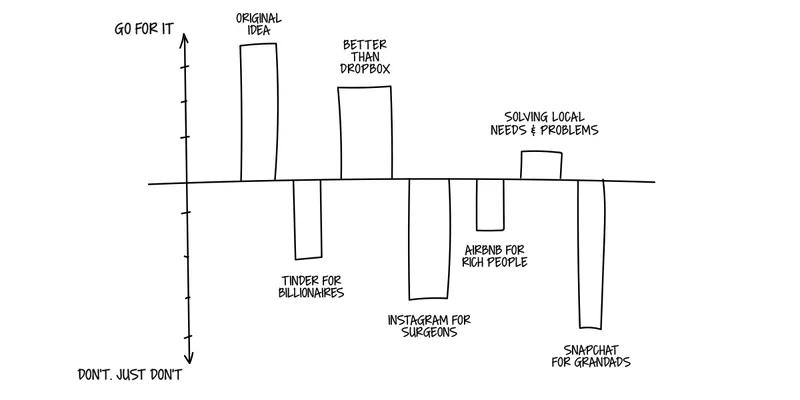
The noted philosopher Sam Harris once said, “Bad ideas are worse than bad people.” It’s true! So, before you startup, get your idea validated first.
3: The “Lie detector” chart
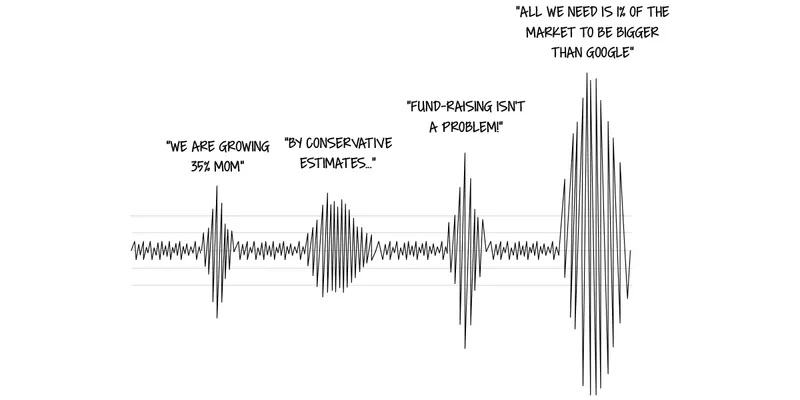
Formula: Spike levels are directly proportional to the level of desperation.
For example,
We are growing 35 percent month-on-month (Spike 35 percent)
We are growing 65 percent month-on-month (Spike 65 percent)
4: The “Personality” graph
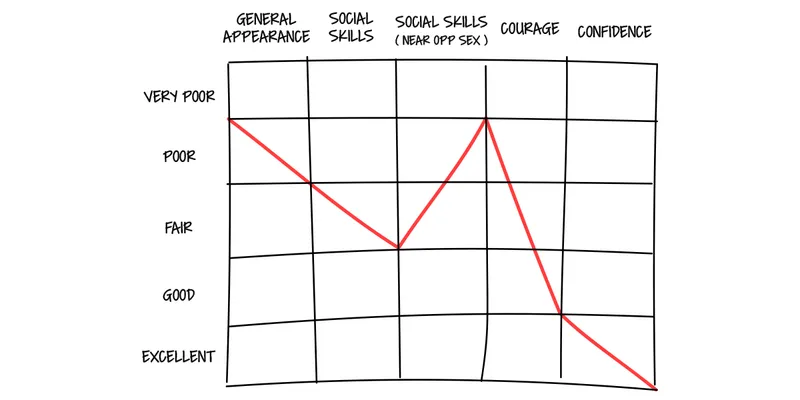
The chart holds good for all entrepreneurs, unless you are a founder of a fashion startup or Evan Spiegel.
5: The oversimplified “A Day in the Life of a Humble Tech Founder” chart
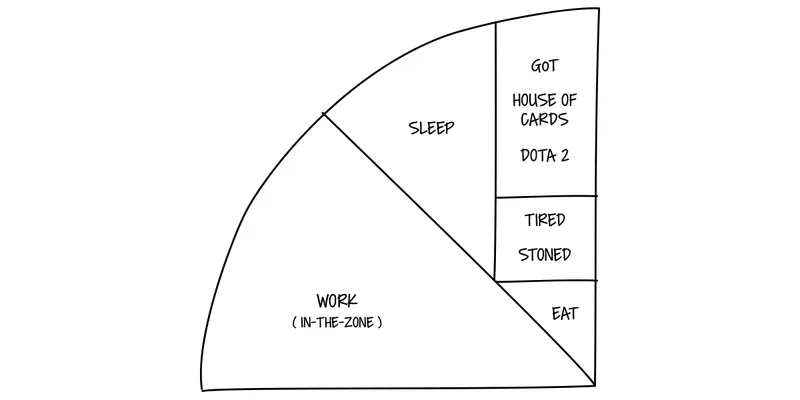
Get two tickets to Rogue One for your tech co-founder as a Christmas / New Year gift. You can thank me later!
6: The “Office Timings” chart
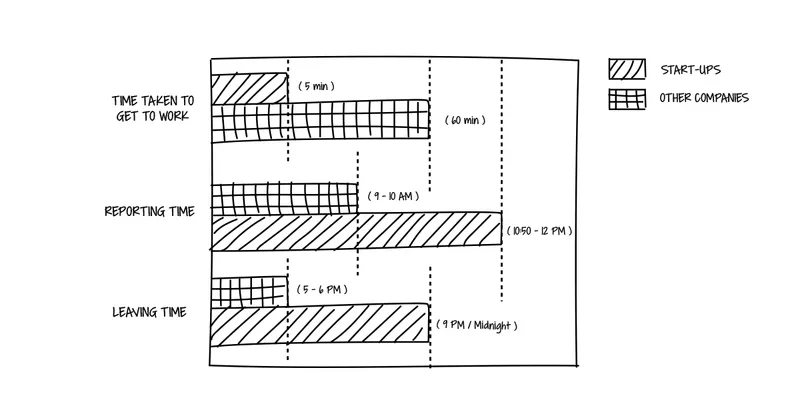
If you decide to report to work before 10 AM, be sure you brought the keys along.
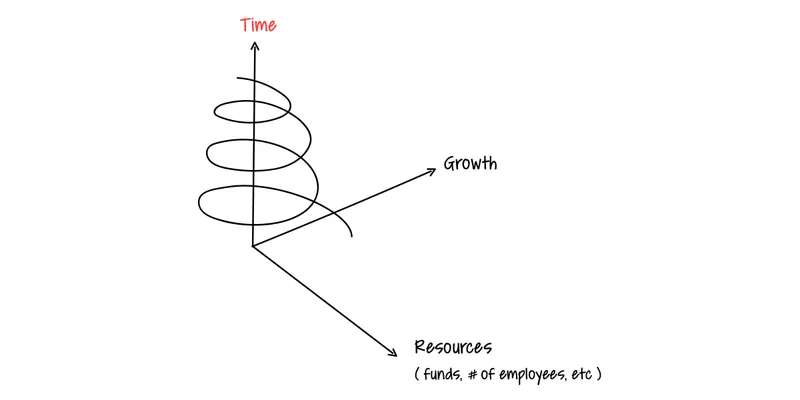
7: The “Hockey Stick Growth” chart
(aka the ‘Vanity Metrics’ graph)
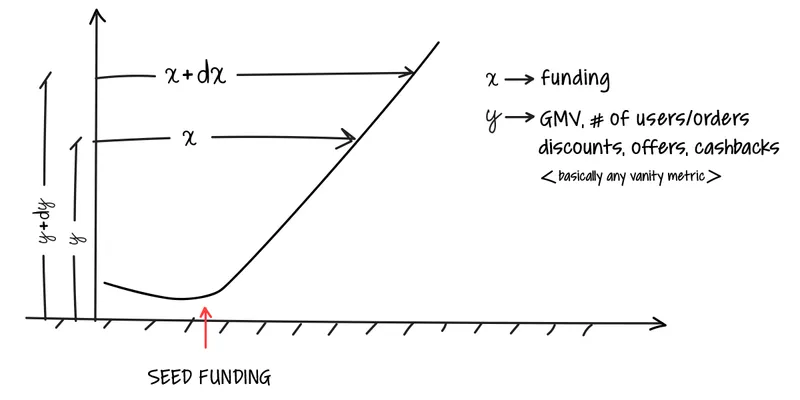
The GMV Cycle: Funding → More discounts → Higher GMV → More funding
As the saying goes,
Money can buy you growth speed, but not better core metrics
(see Cobra Effect)
8: The “Cause and effect” graph
Also, Code →Hustle →Code →Repeat.
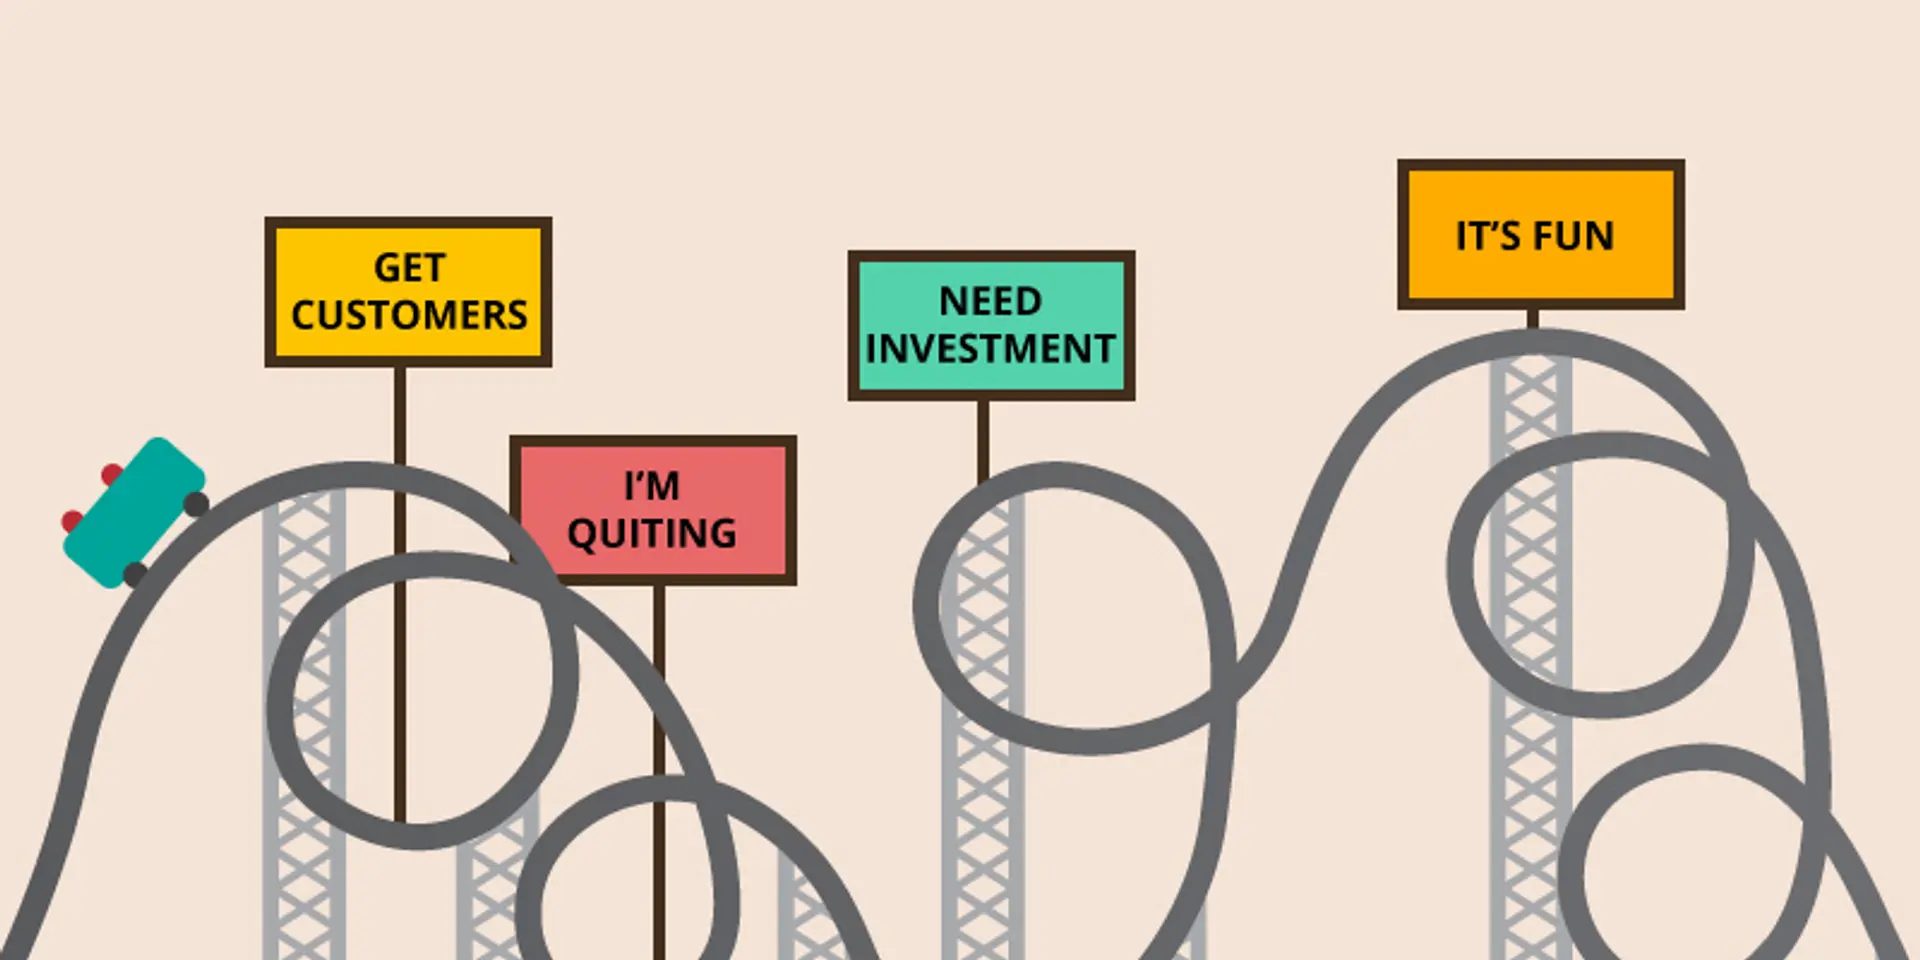
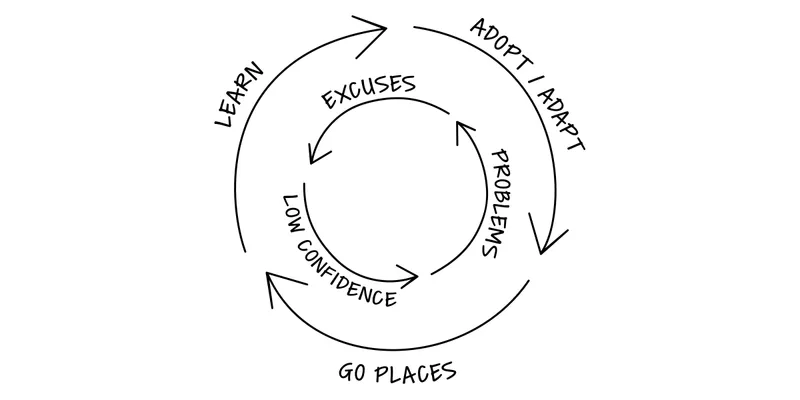
9: The typical startup “Roller-coaster” growth chart
Highs and lows are part and parcel of the startup journey. So, never give up. Keep at it, till the very end.
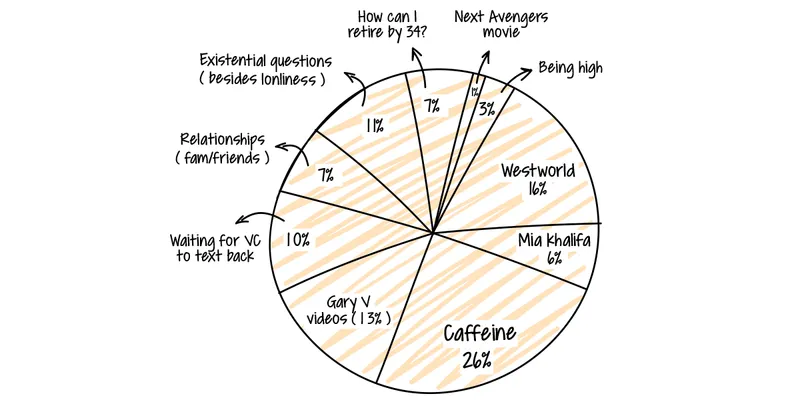
10: The “What keeps you awake at night” chart
(besides cash-in-the-bank worries)
Many of these unique oddities of the startup life are what sets founders apart. As I finish writing this, I wonder if there is a correlation between certain habits and startup success.
Having said that, I also know there is no specific habit or quirk that guarantees startup success. The only thing that gets you there is sheer persistence and hard work. But, it helps to understand if successful founders share certain habits that helped them create flourishing companies.
(Disclaimer: The views and opinions expressed in this article are those of the author and do not necessarily reflect the views of YourStory.)